Looking at these numbers, it’s no wonder the U.S. had to set up a whole agency just to chase government waste. If this trend continues, Australia might need one too.
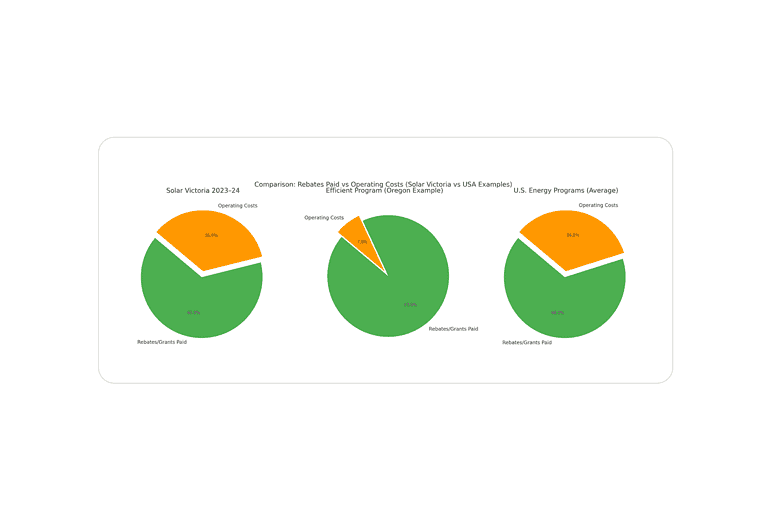
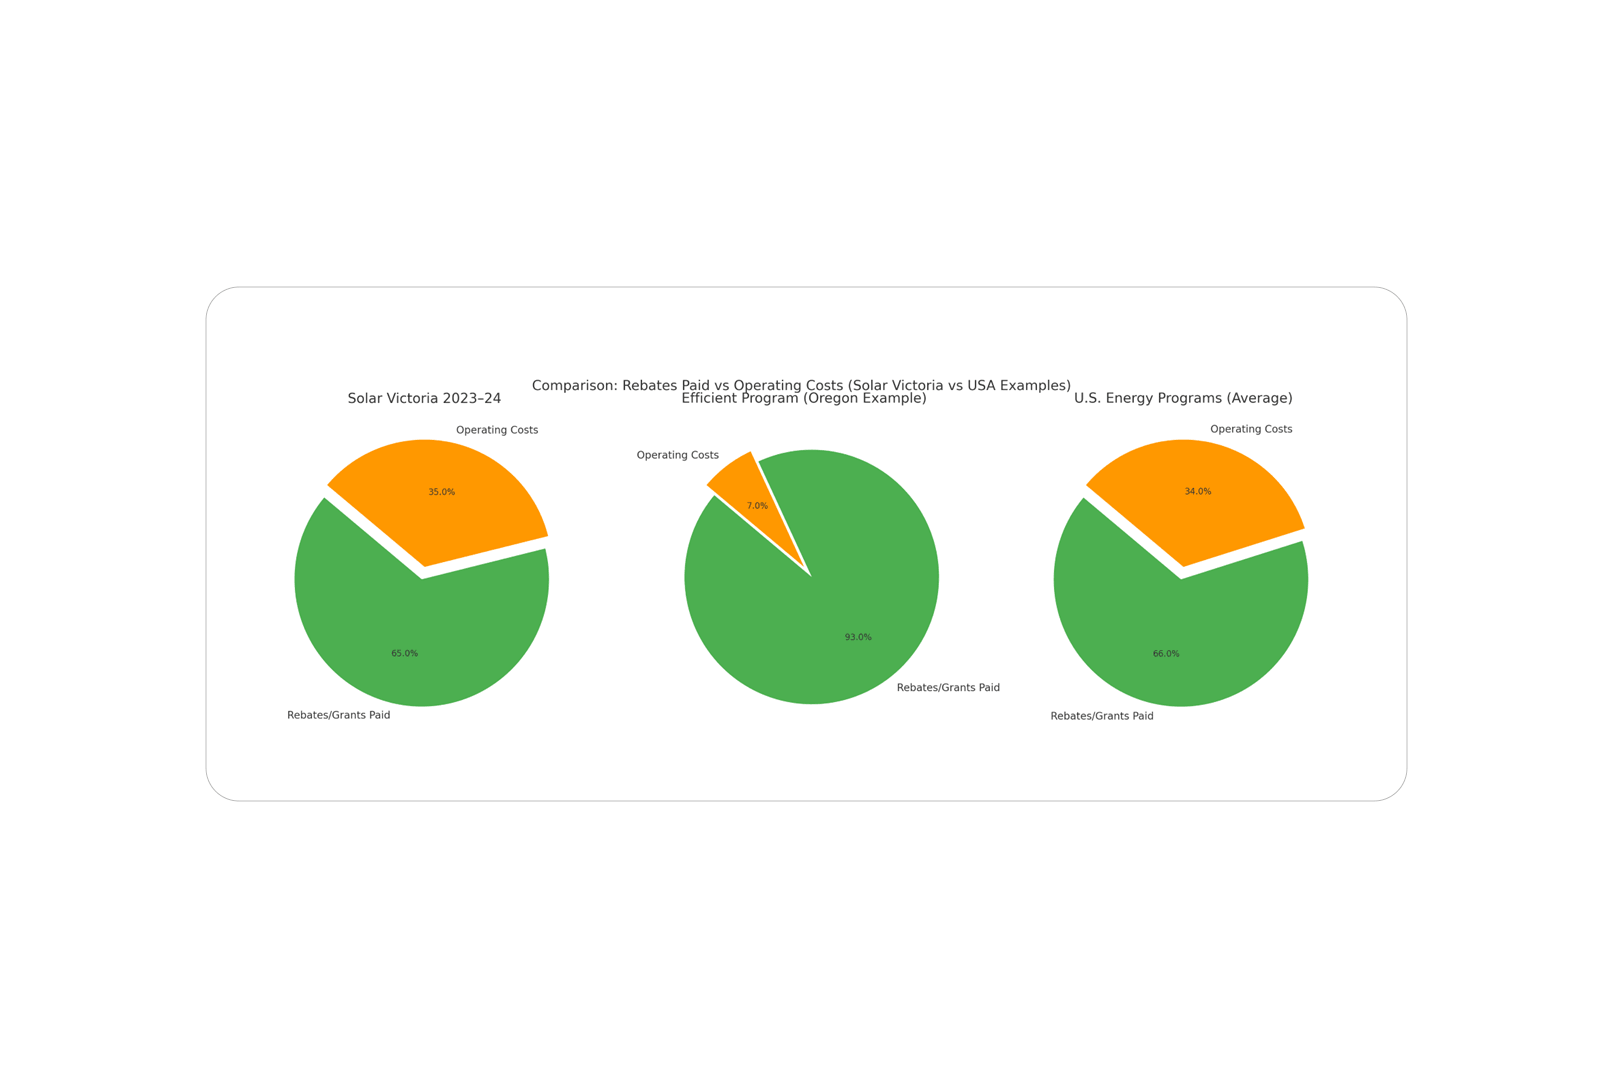
This chart compares how funds are allocated between public rebates and operating costs across different solar and energy programs:
Efficient Program Example (Oregon): 93% of funds went to rebates, 7% to operating costs.
U.S. Government Energy Programs Average: 66% of funds went to rebates, 34% to operating costs.
Understanding how much money actually reaches homeowners in solar rebate programs — versus how much is spent running the programs — is important for making sure renewable energy efforts deliver real value. Here’s a detailed look at Solar Victoria’s 2023–24 operations, and how it compares to similar programs around the world.
Solar Victoria 2023–24: Expenses and Rebates
Solar Victoria’s 2023–24 financial report shows:
Category
Amount (AUD)
Grants and Transfers (Rebates Paid)
$88,883,001
Salaries and Employee Benefits
$23,818,411
IT, Marketing, Office, and Services
$12,542,706
Interest Expenses (Borrowings)
$10,353,037
Depreciation and Amortisation
$23,570
Total Expenses
$135,620,725
Rebates Paid: $88.88 million (65% of total spending)
Operating Costs (Admin, Salaries, Interest, IT, etc.): $46.74 million (35% of total spending)
In simple terms:
About 65 cents out of every dollar Solar Victoria handled in 2023–24 went directly into public rebates.
About 35 cents was spent running the agency itself.
Government Solar and Energy Rebate Programs: Typical Cost vs Rebate Ratios
Globally, government rebate programs aim to keep administrative costs low, but the real-world figures vary:
Program (Government)
Admin/Operational %
Rebate/Benefit %
Notes
U.S. Energy-Efficiency Rebates
≈34%
≈66%
National average (ACEEE report)
Oregon Clean Vehicle Rebate (USA)
7%
93%
Example of a highly efficient program
UK ECO Energy-Efficiency Obligation
≈7%
≈93%
Home insulation and efficiency scheme
Typical government rebate programs spend 5–30% of funds on administrative costs. Efficient programs (like Oregon and the UK’s ECO) manage to keep admin below 10%, while more complex programs (like U.S. energy rebates) see admin costs climb to 30% or more.
Private Sector Rebate Programs: Different Model
In private sector rebate and cashback promotions, the structure is different:
Program (Private)
Industry/Type
Benefits Distributed (Redeemed %)
Notes
Mail-in Product Rebate (Retail)
Electronics, Appliances
10–30% redeemed
Most small rebates never claimed
Digital/Instant Cashback Programs
Retail, Online Shopping
≈78% redeemed
Higher redemption when claims are easy
Mail-in rebates (common with appliances and electronics) are often poorly redeemed — only 10–30% of customers claim the benefit.
Digital cashbacks (like app rebates) are much better, with around 78% redemption.
Private companies tend to spend very little on administration, because most processing is automated. However, the effective benefit delivery depends on how many people actually claim the rebate.
How Solar Victoria Compares
Measure
Solar Victoria 2023–24
Typical Government Programs
Share spent on rebates
65%
70–95% (target)
Share spent on operations/admin
35%
5–30%
Compared to the most efficient programs worldwide (where 90–95% of funds reach the public), Solar Victoria’s 65% result shows higher operational costs than ideal. It performs similarly to average U.S. energy programs (which often spend about 34% on administration).
Summary
Solar Victoria spent 35% of its 2023–24 budget on operational costs, with 65% paid out as public rebates.
Well-run programs internationally (like Oregon’s vehicle rebate and the UK’s ECO scheme) keep admin costs under 10%, meaning more than 90% of funds go directly to households.
Typical government energy programs around the world spend between 5% and 30% of their budgets on administration.
Private sector rebates are often even cheaper to process, but many advertised rebates go unclaimed.
In global terms, Solar Victoria’s efficiency is average compared to large government programs, but significantly less efficient than the best-run public or private rebate systems.